Education Snapshots
Students with disability
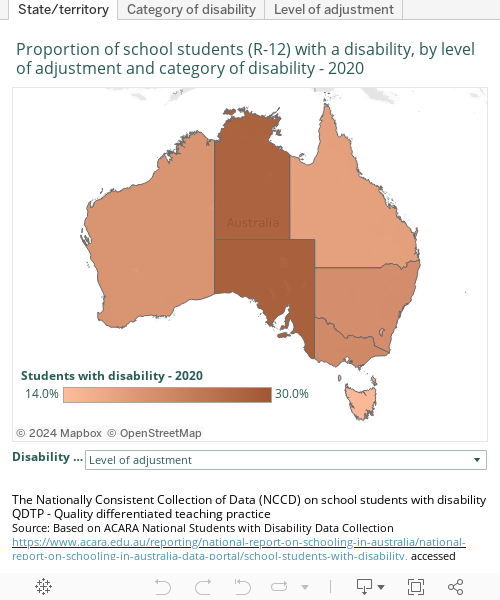
The Nationally Consistent Collection of Data (NCCD) provides information about school students with disability who require adjustments to enable them to participate in education on the same basis as other students. Teachers assess students, using their professional judgement to make decisions about the level of adjustment and category of disability for students. The NCCD data therefore reflect teachers’ assessment of the level of disability adjustment required and broad categories of disability for students with disability.
The level of adjustment categories are: support provided with quality differentiated teaching practices (QDTP), supplementary, substantial, and extensive.
Students who receive support provided with QDTP have adjustments made infrequently as occasional action or frequently as low-level action (eg, monitoring). Students receiving supplementary support receive adjustments for particular activities at specific times during the week, substantial adjustments occur at most times on most days and extensive adjustments occur at all times. Further information about levels of disability adjustment can be found at the NCCD website.
The broad categories of disability are: physical, cognitive, sensory, and social-emotional.
In 2020, almost 3 in 10 school students (27%) in South Australia received disability adjustments under the NCCD. This is an increase from 19% in 2015 and substantially higher than the national average (20%). The level of adjustment category with the highest proportion was ‘supplementary’ (12% in 2020) and the category with the most students was ‘cognitive’ (17% in 2020).
Science literacy
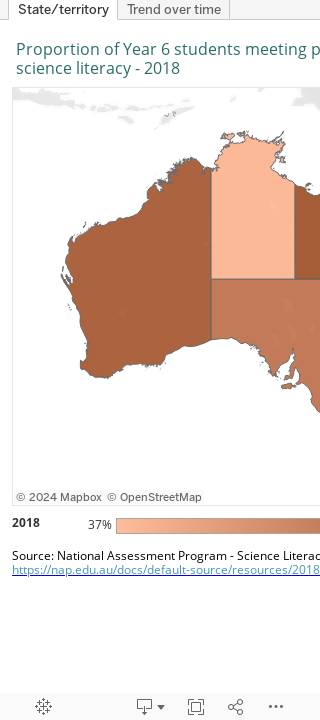
The National Assessment Program for Science Literacy (NAPSL) is conducted every three years with a sample of Year 6 students across Australia. The NAPSL assessment covers science understanding, science as a human endeavour and science inquiry skills. The proficient NAPSL standard represents a ‘challenging but reasonable’ expectation of student achievement at the Year 6 level.
In 2018, the proportion of Year 6 students in South Australia at or above the NAPSL proficient standard was 55%, up from 51% in 2012. (In 2006 the proportion was 52%).
More education snapshots
- Early childhood development
- Spelling
- Writing
- Reading
- PISA mathematical literacy
- Numeracy
- Young people in full-time education
- School attendance
- Apparent retention rate
- Senior school certificate